STVV (Sint-Truidense V.V.), Belgian Pro League · Sep 2025 – Jun 2026 · Marketing & Data Analyst
Where the growth actually came from
+23.6% volume, +17.6% revenue
Season ticket base over two seasons
The club grew its season ticket base by nearly a quarter in two seasons. Revenue grew more slowly, and almost all of the gap traced back to a single stand.
Context
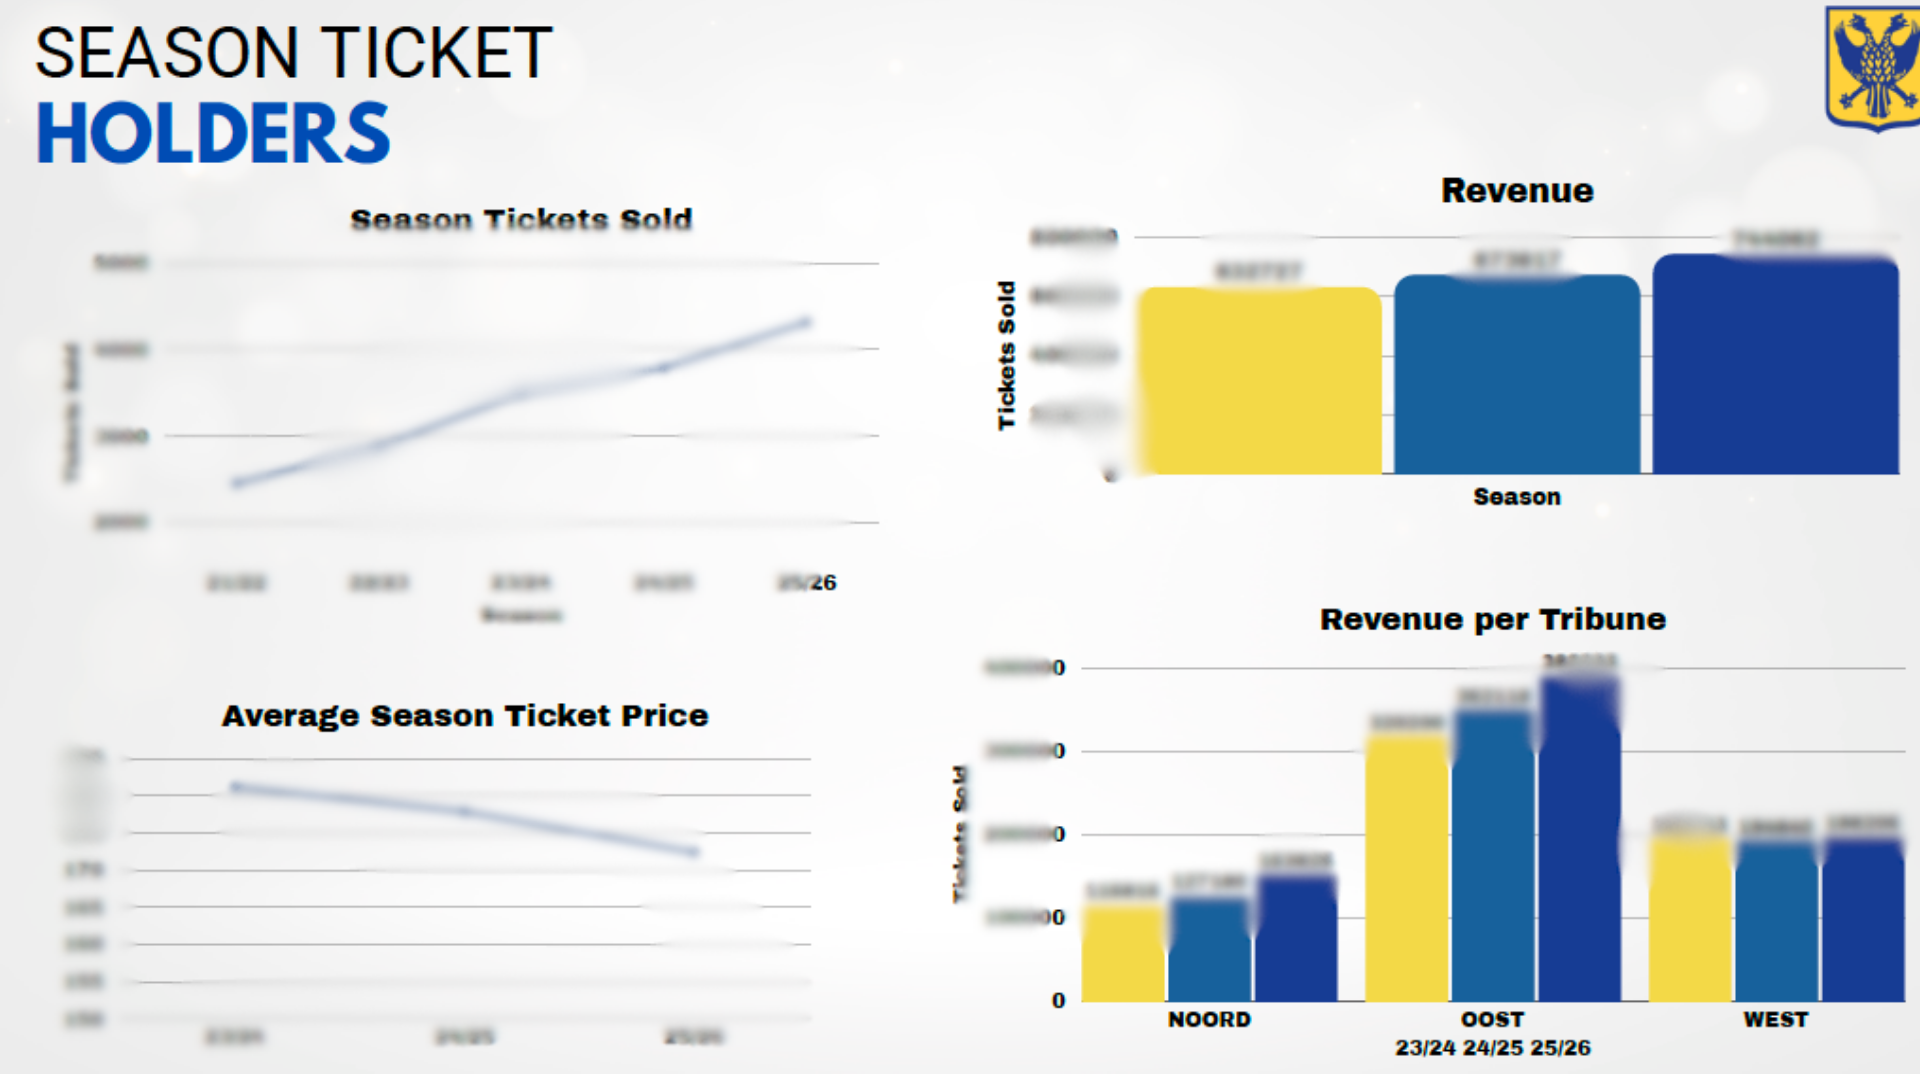
Season ticket volume rose from 3,492 to 4,316 across three seasons, and the club was reporting that growth as a headline commercial success. Revenue over the same period rose from €632,727 to €744,062. Volume grew 23.6% and revenue grew 17.6%, so average revenue per season ticket fell from €181 to €172, down 4.9%. Nobody had asked why.
Constraint
A blended average price hides everything that matters. The club had three stands at very different price points and very different demographics, and the reporting rolled them into one number. Separating the effect required the reconciled per-stand data, and the internal figures for renewals and new buyers did not agree across sources, so the analysis had to be built on the counts that could be independently verified rather than on the churn tables.
Approach
- 01Split volume, revenue and derived yield by stand rather than reading the blended average.
- 02Compared each stand's growth rate against its yield movement to separate price effects from mix effects.
- 03Cross-referenced the stand-level picture against demographic data, since average age varied from 33 to 51 across the three stands.
- 04Separated paid season tickets from comped ones, which had been reported together, and recalculated the growth rate on the paid base alone.
Outcome
- The yield decline was not discounting, it was mix. Two of the three stands held their yield almost exactly: the main stand moved from €161 to €162 per season ticket, the premium stand from €289 to €286. The cheapest stand fell from €141 to €128, down 9.5%, and it was also the stand doing the growing, up 46.6% in volume against 21.5% and 1.9% for the other two. The club had grown its base by expanding the bottom of its price ladder, with no established route to move those supporters up it. That reframed the commercial question from "why is yield falling" to "what is the migration path from the cheapest stand to the next one", which is a retention and product question rather than a pricing one.
- Two supporting findings came out of the same split. Comped season tickets grew 32.6% against 23.6% for paid ones, so roughly 28% of total base growth was non-paying and the headline growth figure was softer than it looked. And the growth was demonstrably young: the cheapest stand averaged 33 years against 51 in the premium stand, non-renewals averaged 37.0 years while new buyers averaged 33.2, and the mean age of the whole base fell from 43.3 to 41.6 in two seasons. The club was acquiring successfully at the bottom of the market and quietly ageing out of the top.
Reflection
I reported this as an observation when it should have been a recommendation. The analysis identifies a migration problem but stops short of proposing the product that solves it, and the obvious next step, modelling which cheapest-stand holders have the spend and attendance profile to convert upward, was available in the reconciled data and I did not build it. The second thing I would change is the framing: presenting "growth is up 23.6%" and "yield is down 4.9%" as two facts on two slides let the room take the first one and move on.
Stack
- Roboticket
- SQL
- Power BI
- Excel